Simulator vs Optimizer
DFS Simulation.
Built for Tournaments.
Simulate the field. Not the constraints.
The Difference
Same inputs. Different output.
Both tools take projections, salary, and slot rules. What they hand back is where they diverge.
Optimizers
Best for Small Field Tournaments
Finds the highest-projection lineup that fits your salary cap, slot, and stack rules.
- Ranks lineups by projected points.
- Sees your rules. Doesn't see the field.
- Can't predict how often a lineup gets duplicated.
Simulators
Best for Large Field Tournaments
Tests every lineup against 50,000 simulated contest fields to see how often it finishes on top.
- Ranks lineups by Top-5% finish rate.
- Models the field, including projected ownership.
- Predicts expected duplicates per lineup.
What Simulation Buys You
The number an optimizer can't give you.
Top-5% Finish Rate
Rank by simulated finish.
Two lineups projected at 145 points can have wildly different odds of a Top-5% finish once you account for ownership, variance, and the field. ETC ranks every lineup by its Top-5% finish rate, the metric that separates tournament builds from the pack.
An optimizer can rank by projection. Only a simulator ranks by simulated finish.
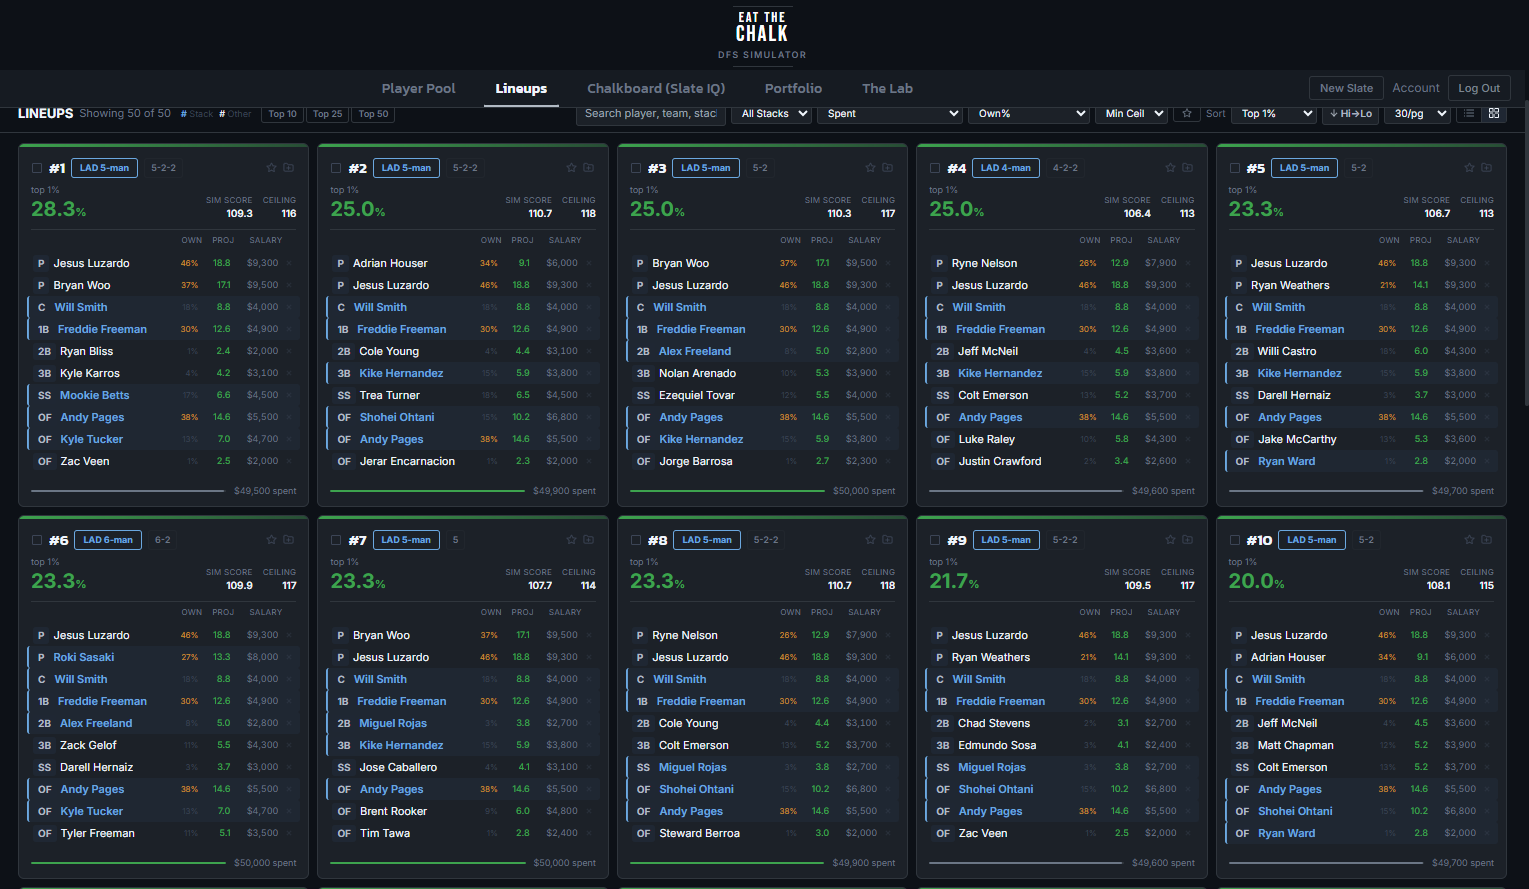
[ Lineups ranked by Top-5% ]
The Methodology Gap
What only a simulator can compute.
Every capability below requires modeling the contest field or modeling player outcome distributions. Without that, you have an optimizer.